It is very disappointing to see the ?? as host of cop26 streaming ahead in feeding the data centre monster, having published its National Data Strategy on the GovUK official portal on 18 May 2021. It baffles the mind as to why the UK aspires to become “the world’s number one data destination.” given what we already know is fast becoming the next biggest source of harming the planet in the wake of Covid19 government lockdown strategies the world over.

Did you know that Big Tech energy consumption is already worse than aviation?
Most people still assume that the aviation sector is the big carbon footprint culprit. But until you start to look at data centres specifically, since Covid19 lockdowns, will you see how easily our use of digital technologies now actually causes more CO2 emissions and have a bigger impact on global warming than the entire aviation industry itself! Here are my thoughts on what is clearly a dynamic topic as I have found many in the tech industry not to be fully aware though the hyperlinks provided will give much food for thought to play an active role in achieving net zero to prepare balanced arguments as ?? hosts of #cop26
Big Tech #energy #consumption is already worse than aviation!! Think data centres, ParisClimateAccord and regulation! The world is lop-sided due to supply-side pressure of the combined GAFAM (Google, Apple, Facebook, Amazon, Microsoft) AND expectations of GDP-related growth to digitalisation must not go unchallenged! It is on users and government regulators to demand a duty of care for the world by questioning the social and economic benefits of digital objects and services that are in fact driving mindless societal behaviours!? Besides, these giant tech platforms current unabated evolution and environmental impact go against the goals of the 2015 Paris agreement. Break it down, let’s rather hold decison-makers on every level accountable as the digital platforms global scope and economic power is so formidable there is no incentive or penalty big enough for them to comply or be cooperative… And that’s notwithstanding adverse health effects from added EMF!
Frightening as it already carries rather heavy baggage: and the energy consumption is constantly growing… an unmitigated risk. “their share of global CO2 emissions increased from 2.5 to 3.7 % between 2013 & 2018. That means that our use of digital technologies now actually causes more CO2 emissions and has a bigger impact on global warming than the entire aviation industry!” – The non-profit organisation The Shift Project looked at nearly 170 international studies on the environmental impact of digital technologies.
How is streaming made possible?
“CO2 emissions are one result of the energy outputs of a combination of the devices we use, the networks they connect to and the data centres housing and serving up Apps such as Netflix. It feels like everything simply sits in “the cloud” but physical buildings filled with row upon row of servers in air-conditioned rooms make streaming possible and Ireland is home to 55 of these data centres. What does this mean for the nation’s energy consumption and carbon footprint? In a March 2020 report from Host in Ireland, Dave McAuley, founder and CEO of BitPower, said in the foreword that Ireland’s total annual electricity use for 2019 was about 28 TWh (terawatt hours) and data centre energy demand was an estimated 10 % of this. With an additional 44 new data centres currently under construction or with approved planning and 5 more going through the application process, this number will most likely rise. EirGrid calculates that, by 2028, data centres will be consuming 29 % of Ireland’s electricity.” – Now extrapolate that consumption to all of UK and then worldwide.

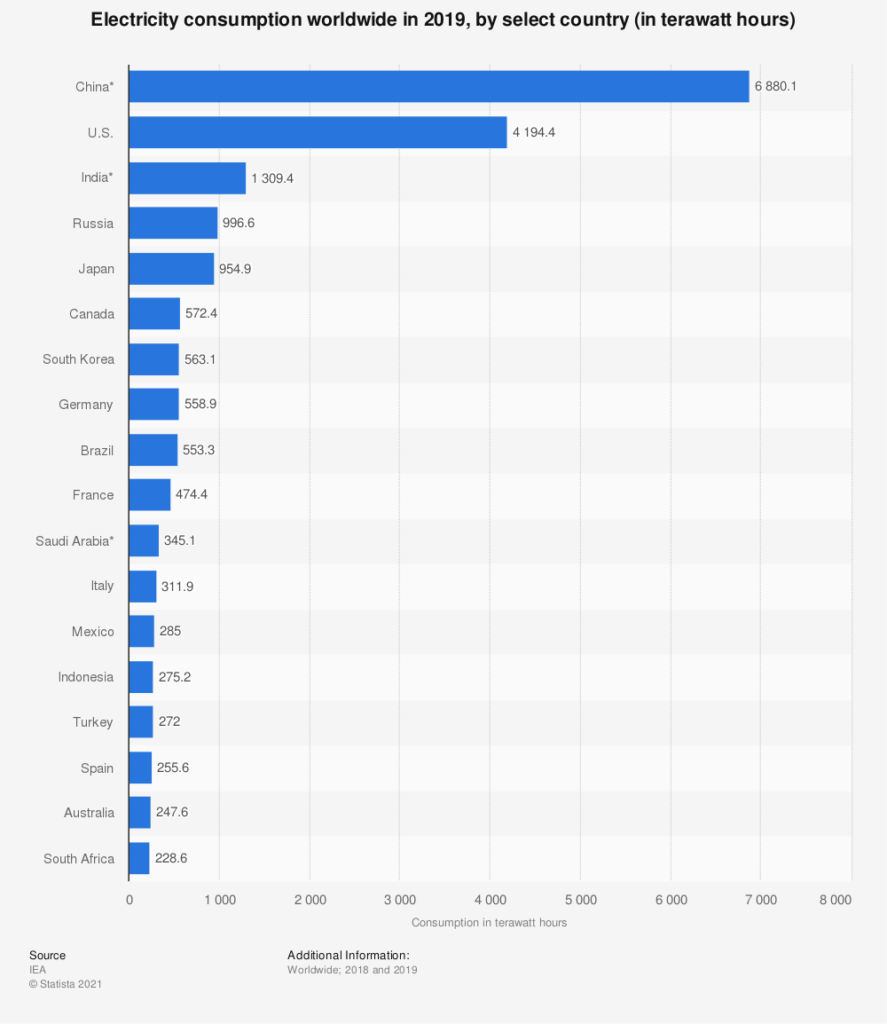
Note from the chart above: The 3 top countries have the largest population. China also consumes the most electricity with the most energy generated sourced from coal. India follows China much more closely in terms of population than in electricity consumption; whereas the US consumes far more electricity than India but has a much smaller population size. The per capita electricity consumption of the US is therefore much higher than that of India. Countries with a high GDP per capita provide residents greater purchasing power. Countries with higher-income residents tend to be more urbanized, leading to higher electricity consumption. The residential sector is the largest electricity consuming sector in the United States.
Did you know the simple impact of zooming in lockdown?
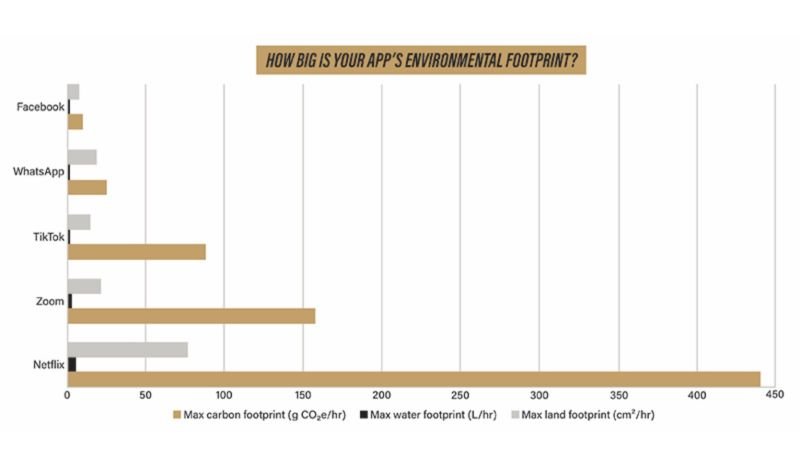
“Just one hour of videoconferencing or streaming, emits 150-1,000 grams of carbon dioxide (a gallon of gasoline burned from a car emits about 8,887 grams), requires 2-12 liters of water and demands a land area adding up to about the size of an iPad Mini. But leaving your camera off during a web call can reduce these footprints by 96%. Streaming content in standard definition rather than in high definition while using apps such as Netflix or Hulu also could bring an 86% reduction, the researchers estimated.”

The responsible approach to emergent technology
Henry Tirri, Chief Technology Officer, InterDigital in weighing up the pro’s & con’s sums up the best responsible approach:
“The advent of 5G holds unprecedented promise for the wireless ecosystem and our world, but we must remain clear-eyed about the staggering energy demands of 5G and its life-changing use cases to develop appropriate and timely solutions,”
Needless to say, now with the UK streaming ahead to build energy hungry monster carbon footprint data centres to become the world’s no.1 data centre destination, it might prove yet another Pyrrhic victory.

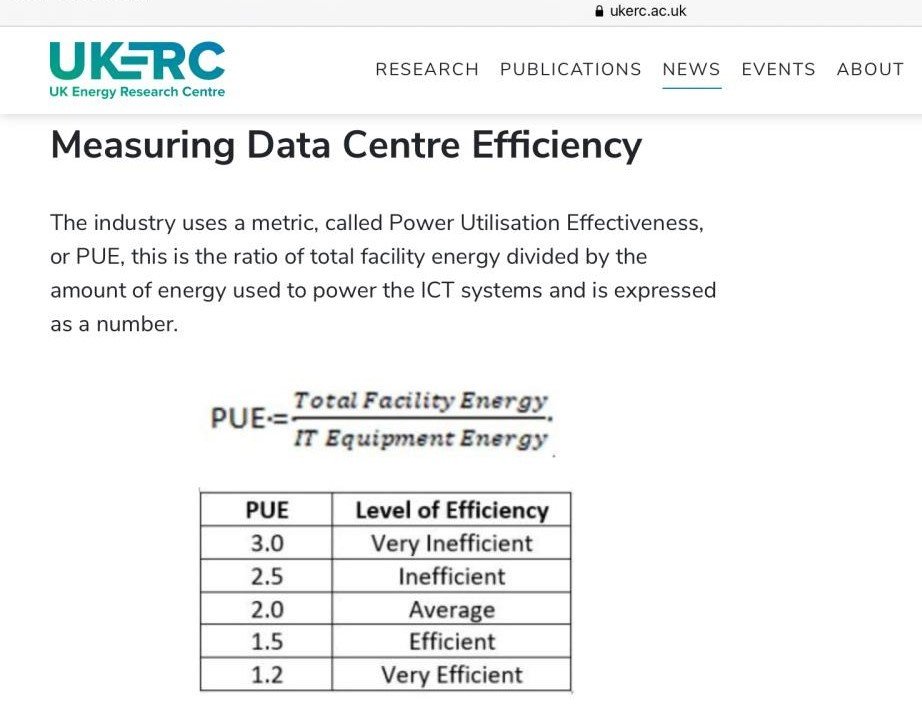
The key industry metric to watch is called Power Utilisation Effectiveness, or PUE, this is the ratio of total facility energy divided by the amount of energy used to power the ICT systems and is expressed as a number. Most Data Centres in the UK are operating at between 1.5 and 1.8, the EU average is 1.8, in some cases even higher. For every 1w of energy provided to the ICT equipment, 0.8 w is supplied to the supporting infrastructure. In Data Centres operating at 2 and above, it means that in effect more energy is being used to provide the supporting infrastructure that is supplied to the ICT equipment. This may mean that more energy is being used to “cool” the infrastructure than is strictly necessary.
As the Environmental Health Trust aptly cautions – not everything that is “legal” is necessarily safe!
This is also why we support doctors and scientists while we focus on frequency, energy, non-ionizing radiation, electric charge and magnetism to educate and reduce the carbon footprint and the cumulative EMF risk on all who are in contact with big tech. We at EMFstrategy are greatly concerned for the health and wellbeing of children who still need to grow and their families or carers in the workplace, i.e. workers at particular risk:
- workers who wear active implanted medical devices
- workers with passive implanted medical devices
- workers with medical devices worn on the body
- pregnant workers


Recent Comments